Within the career development pages of b-school websites is a hidden gem that stores the most relevant information for prospective applicants: the MBA employment report. As a majority of applicants do an MBA for better employment opportunities, this is one data they must definitely research in their quest for finding the right MBA programs. B-schools publish MBA employment reports every year for the class that graduated a year earlier. They also provide past reports so that applicants can observe hiring trends and make informed decisions about which b-schools will help them meet their career objectives.
In this blog we breakdown the MBA employment report and help you make sense of it. The information provided in this report varies between MBA programs, but for the sake of this article we will discuss the most commonly published sections.
The summary:
Many MBA employment reports start with a summary from a career services centre representative, usually the director. This summary will give you a snapshot of the recruitment, which industries were most sought after, which companies recruited heavily etc. You’ll also read about changes in hiring trends in this section and also any achievements of the b-school related to recruiting, for example, new recruiters on board.

The Demographics:
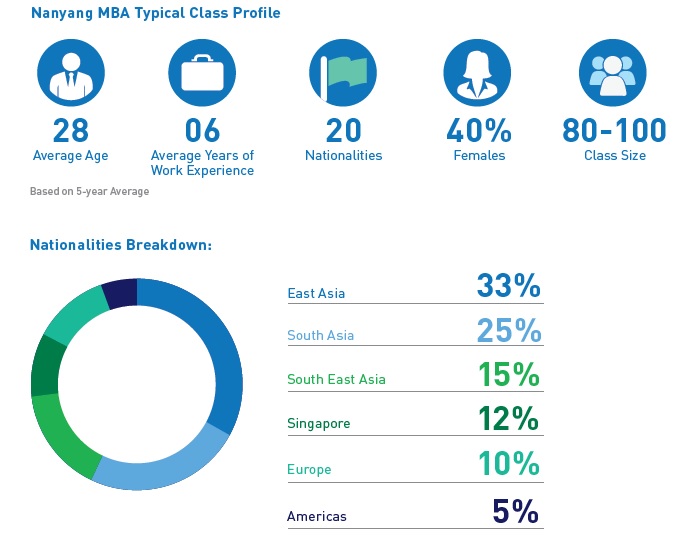
The first section in the MBA employment report contains a profile snapshot of the graduating class. Relevant details in this section are the class size, average age and work experience, percentage of international and women students. Some reports also provide the geographic spread of the pre-MBA class, their pre-MBA industry, and past education.
This section will inform you about where the graduating class stood, and how you compare to them.
Source for Job Search
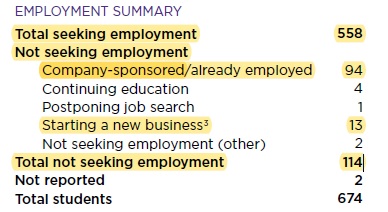
This section tells about the channels students used for their job search. The first piece of info is how many students sought jobs and how many didn’t. The report is richer and more nuanced when a larger size of class participates for its data collection. It also reflects students willingness to share details about their jobs and salaries, thus making the employment report more transparent.
For those students who did not seek jobs, there could be several reasons: they were going back to their old company, they started their business, they were studying further or they simply postponed job search. If you wish to turn an entrepreneur while at business school, you must look closely at this data to know how many students started-up while in b-school. The number is bound to be small, as MBA education is expensive and students land up with hefty loans that make starting a business immediately after MBA unfeasible.
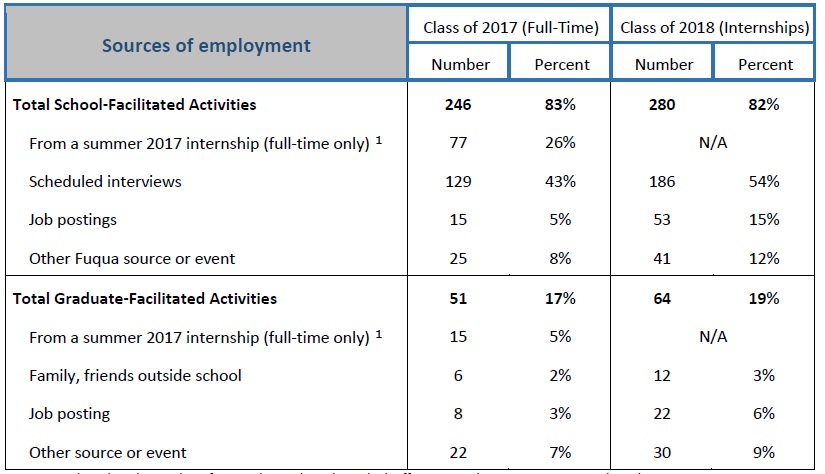
Students can find jobs through two methods: b-school facilitated job search and Student facilitated job search.
B-school facilitated recruitments involve on-campus interviews, summer internships, job postings, and alumni connections. Stronger school facilitated recruitments demonstrate that the program has an active and efficient career services team. If you are an international applicant with little network in a foreign land, you would definitely want a supportive team that works with you closely in your job search.
Student facilitated recruitments occur through networking and students’ own efforts. B-schools don’t give much data on this, as obviously, they are not involved here.
Timing of recruitment:
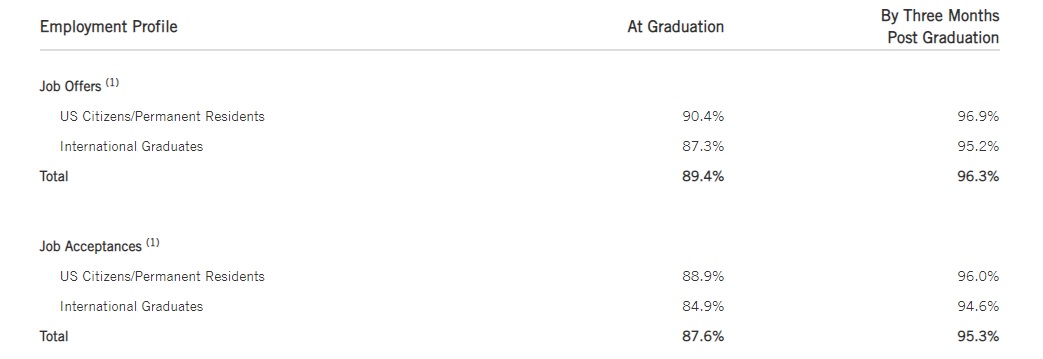
The next category in the MBA employment reports is the time by which students found jobs. This data is published for “at the time of graduation” and “3 months after graduation”. As a prospective applicant, you would want to ensure that graduates are getting recruited at the earliest. If you are an international student, pay attention to the data for international graduates.
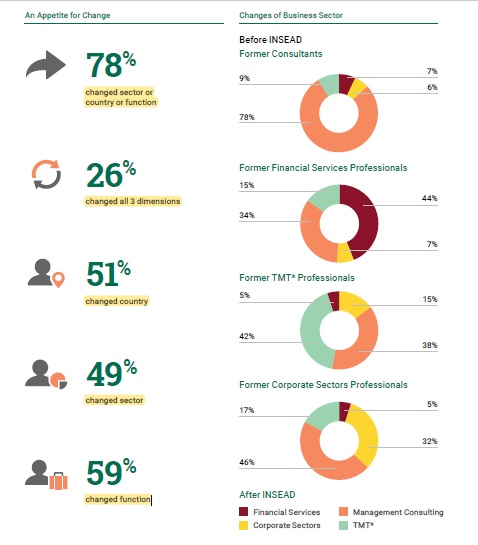
The next section provides a breakup of jobs attained by industry, function and geography. This is the real meaty information. The most prevalent reason for doing an MBA is a career change. An MBA helps students change their careers by changing either industry, or functions, or geography or two or more of these dimensions. While the European MBA programs publish this info as well, most American programs don’t.
Data by industry
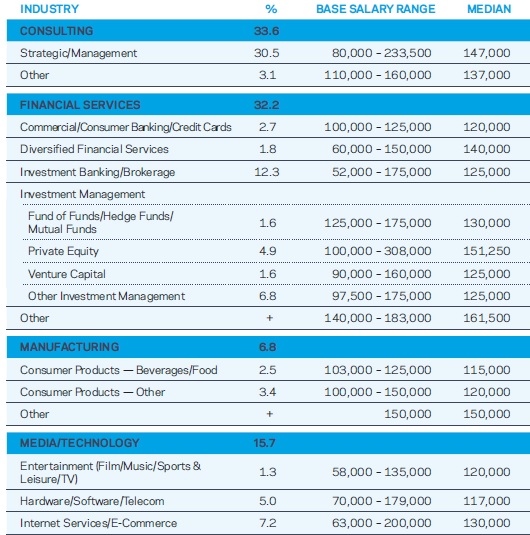
This comprises a list or a graphic of the industries where graduates got their post-MBA jobs and also highlights the salaries (low salary, high salary and average salary per industry).
As a prospective applicant, you should closely observe these numbers to determine whether your target industry is represented. Its also a good idea to check past reports to understand trends over the years. For example, technology recruitments have consistently risen up at b-schools whereas consulting recruitments stay more or less static. If you wish to recruit for the technology industry, then an upward spike in the figures will give you more reason to apply.
A wider representation of different industries denotes diversity in the class. It also depicts that career services have a robust network with a range of industries.
Certain industries such as the financial services are vast and jobs vary highly. Thus, data is further broken down into subcategories such as investment banking, hedge funds, investment management, private equity/venture capital, etc. For applicants vying these jobs, this is a more relevant data point, and they should compare these figures with other target programs to get the real picture.
Data by function
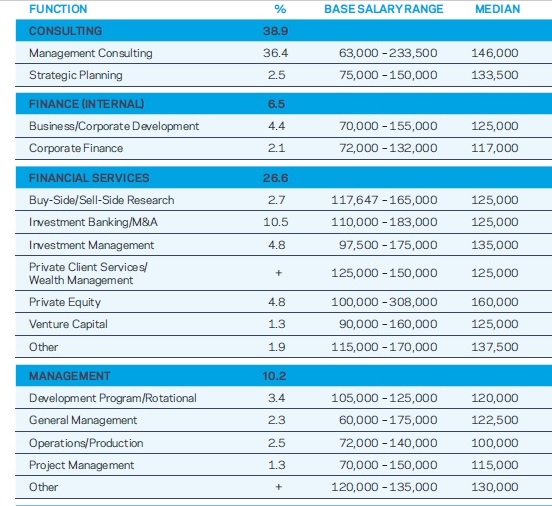
This section of the MBA employment reports provides a function-wise breakup of jobs and salaries. This data will be particularly useful to you if your job search is driven by the function, say marketing, operations, strategy, or general management, to name a few. This section is also relevant if you are interested in joining a rotational/leadership development program – you can see whether a b-school gets companies for such roles. Similarly, many applicants are interested in internal consulting or strategy, and this is the section where you will find data about it.
Data by Geography
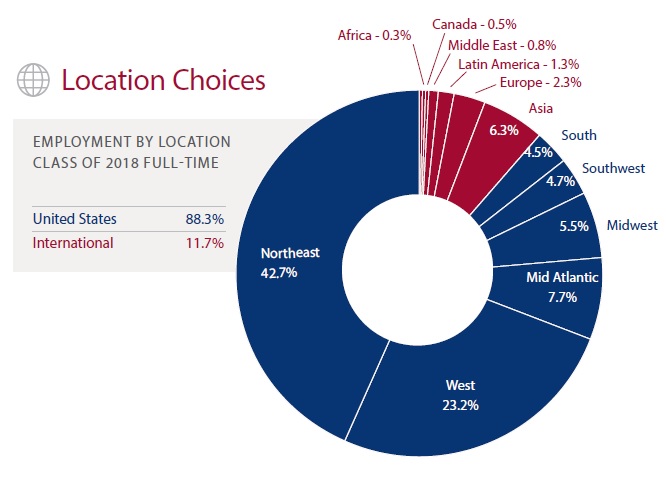
Recruitments in the American MBA programs are mostly limited to the US, with 85% to 99% of the class staying in the US. Interestingly, the data published by American MBAs captures different regions in the US, such as the East Coast, the West Coast, the Mid West etc. However, the data for international placements is split per continent.
Hiring companies:
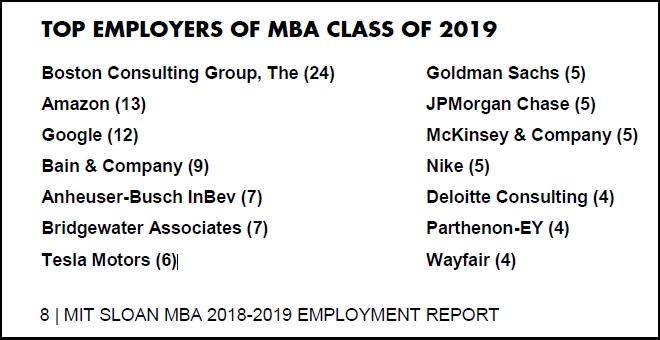
You’ll also find a list of the hiring companies within the MBA employment reports. Many b-schools share the number of graduates that were hired by each company. If you are targeting specific companies post MBA, this is an important data point in your b-school research. Career services teams work hard to form and maintain relationships with recruiters, therefore consistently finding one recruiter in employment reports year after year, tells about the relationship career services has nurtured with that recruiter. Also, a company will repeatedly recruit from a b-school only if they get good quality applicants.
Internships:
The same data as for graduates is repeated over for the interns, that is year 1 MBA students who undertake summer internships.
To summarize, while every other parameter used for evaluating b-schools will help you make your experience tailored to your needs, its the employment statistics that will educate you about the real outcome of your MBA education – the job. So don’t overlook this while selecting business schools. You now know how to interpret the report, so make the best use of it and apply to the programs best suited for your needs.
